Skill shortages, emigration and unemployment in Poland - causes and implications
1. Introduction and problem definition
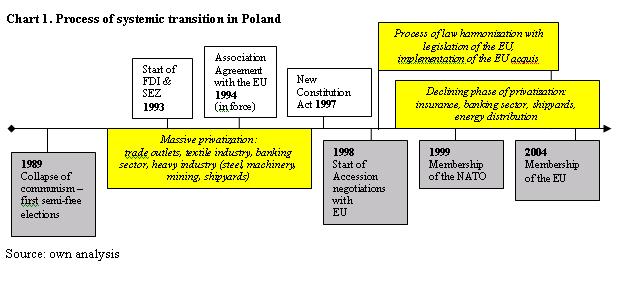
The causes of skill shortages in Poland are both complex and varied. A host of factors that operate singularly or in combination influence the content and nature of these shortages. The characteristics of causes and implications of skill shortages in Poland also vary over the structure of the Polish labour market and are determined by the rationale of certain changes in the Polish economy and may co-exist with high unemployment and labour outflow (emigration). The scale of skill shortages and levels of their diversity may be symptomatic of the systemic transition in Poland.
2. Labour market adjustments in Poland – a synopsis
The transformation from a centrally planned economy to a market economy has been accompanied by far-reaching changes in the labour market. “Excess demand for labour and shortage of labour were replaced by a surplus of labour and shortage of jobs. Consequently, unemployment emerged and grew rapidly: former centrally planned economy converted from ‘job rights’ economy to ‘job search’ economy” (Dorenbos 1999: 1). The next stage of this transformation seems to be a ‘skill search’ economy.
See pdf file for full-size image
Chart 2.
Structure of Foreign Direct Investment in Poland 1993-2004
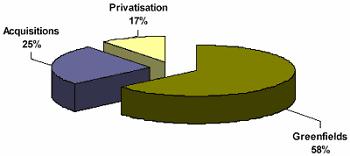
Source: Polish Information and Investment Agency
It is apparent that the role of labour structure is crucial in the process of systemic transition and economic growth both in qualitative and quantitative respect. Optimal allocation of labour, namely putting the right person with the right skills in the right place, is an enormous and complicated process. The quality of labour is now crucial to match the needs of transformed economic structures. Selection of workers on the basis of labour market characteristics, which reflect their labour productivity, may emphasize the new structure of the economy. Wages determined by economic forces are a consequence of these changes. Moreover, job competition and crowding-out effects may lead to the process of segmentation of the labour market (Piore 1979)– for example, a labour market which contains ‘insiders’ doing relatively well in growing industries and ‘outsiders’ either employed in declining industries or unable to enter the labour market because of their inappropriate skills. Poland’s employment structure is a good example of this (tables 1 and 2).
Table 1. Key economic indicators for Poland 2001-2005
|
POLAND |
2001 |
2002 |
2003 |
2004 |
2005 |
|
GDP (%) real growth |
1.1 |
1.4 |
3.8 |
5.3 |
3.4 |
|
Inflation rate (%) |
5.5 |
1.9 |
0.8 |
3.6 |
2.1 |
|
Economically active population (‘000) |
17376.00 |
17213.00 |
16945.00 |
17025.00 |
16960.00 |
|
Employed population (‘000) |
14206.00 |
13782.00 |
13612.00 |
13795.00 |
13868.00 |
|
Unemployment rate (%) |
18.24 |
19.93 |
19.65 |
18.97 |
18.23 |
|
Net migration (‘000) |
-16.74 |
-14.95 |
-44.00 |
-51.79 |
-48.44 |
|
Population mid year (‘000) |
38638.3 |
38627.1 |
38605.3 |
38569.1 |
38530.1 |
Source: Euromonitor International – Global Market Information Database
Table 2. Employment structure in Poland 1980-2005
|
Year |
Agriculture |
Industry & Construction* |
Services |
|||
|
|
MF |
|
MF |
|
MF |
|
|
1980 |
29.9 |
40.0 |
32.2 |
|||
|
1990 |
25.2 |
37.0 |
35.8 |
|||
|
1991 |
25.4 |
36.0 |
38.0 |
|||
|
1992 |
25.0 |
34.6 |
39.8 |
|||
|
1993 |
25.7 |
31.5 |
42.6 |
|||
|
1994 |
24.0 |
31.9 |
43.9 |
|||
|
1995 |
22.6 |
32.0 |
45.3 |
|||
|
1996 |
22.1 |
31.7 |
46.2 |
|||
|
1997 |
20.5 |
31.9 |
47.6 |
|||
|
1998 |
19.2 |
32.1 |
48.7 |
|||
|
1999 |
18.7 |
29.9 |
49.8 |
|||
|
2000 |
18.7 |
30.8 |
50.3 |
|||
|
2001 |
19.2 |
30.6 |
50.6 |
|||
|
2002 |
19.3 |
28.6 |
52.0 |
|||
|
2003 |
18.4 |
28.5 |
52.9 |
|||
|
2004 |
18.0 |
30.3 |
53.1 |
|||
|
2005 (mid year) |
16.8 |
29.4 |
53.7 |
|||
MF – male + female;
* I+ C since 1999
Source: Own calculations based on Key Indicators of the Labour Market 2001-2002, ILO; Central Statistical Office Poland (various years) and BAEL.
The production structure, the sectoral composition of firms and the occupational structure of the labour force have undergone radical changes. Undoubtedly some branches have been affected more strongly by these changes than others. The current unemployed certainly need additional training and schooling to fit into the new conditions in terms of the occupational structure. Furthermore, the skills of those in employment and also the new entrants to the labour market have to be adjusted to cope with the new production structure. It is clear that this reallocation process has had to take place much more quickly than any recent economic adjustment in Western Europe has required, and it has resulted in both labour surpluses and skill shortages (Dorenbos 1999).
3. Mismatches, shortages, unemployment and labour mobility
A lack of coherence between supply and demand creates the basis for labour market shortages. It aims to research the differences between certain segments and dimensions of the labour market: territorial, occupational, age structure, branch of economy, level of education.The developed concept of structural shortages covers a lot of definitions, measures and interpretations. F.P. Schioppa at al. (1991) present four key interpretations of skill mismatch developed in economic analyses. The first one relates to the turbulences in the economy. This approach was developed by D.M. Lilien (1982), K. Abraham, L. Katz (1986), P. Loungani (1986), P. Loungani, M. Rush, W. Tave (1990) and S. Davies and J. Haltiwanger (1992). Collapse of certain industries and the growth of new forms of entrepreneurship may generate economic shock. This process is connected to certain technological innovations, changes in foreign competition and changes of relative prices of resources. These factors affect the structure of employment. An unemployment rate grows in the declining sectors and at the same time vacancies are growing in the developing sectors (regions). This implies deeper mismatches of demand and supply of labour across sectors and/or regions. In order to negate these mismatches, high flexibility is demanded of the labour market. This includes the flexibility of wages and prices, high mobility of labour and free access to information on the labour market (Brunello 1991: 57). A second interpretation concerning structural mismatches relates to the lack of equilibrium in micromarkets, namely regional and sectoral markets. The third approach connects mismatch with ineffective allocations of labour. The fourth interpretation comes from the NAIRU model (Non Accelerating Inflation Rate of Unemployment), which strictly relates to labour resources. In order to explain the situation in the Polish labour market, the theory of turbulence in the economy seems to be the most adequate.
The restructuring of the Polish economy, affecting the labour market, may also create regional diversification. This means that this process of restructuring may cause regional mismatches in supply and demand in Poland, which then creates skill shortages. This is well grounded in the labour market geography of Poland. Some branches of the economy are attached to certain regions of Poland- e.g. shipping industry, heavy industry, and agriculture. This means that certain regions of Poland have been defined by a certain production activity. One may assume that regional variations in the labour markets may cause structural mismatches (Gawronska-Nowak, Kaczorowski 2000). A thesis on the influence of the restructuring of the economy on unemployment was verified by Kaczorowski, Tokarski (1997), Gawronska-Nowak, Kwiatkowski, Kubiak (1998).
Differentiations in regional flexibility of labour demand are also questioned from the perspective of the level of real wages and low mobility of labour in Poland. This may have a negative impact on the flexibility of the labour market and may enhance and petrify regional mismatches of supply and demand (Gawronska-Nowak, Kaczorowski 2000).
3.1. Regional variations of economic and labour market performance
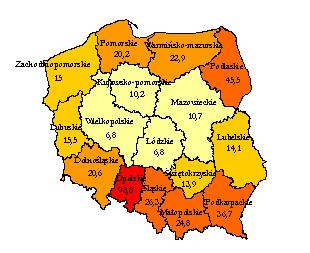
Full employment was a major policy goal in all former centrally planned economies. Job security was anchored in the socialist welfare state. On the whole, every person over school age and under retirement age was entitled to work (Dorenbos 1999). Nowadays the situation is totally different. Excess demand for labour and shortage of labour were replaced by a surplus of labour, a shortage of jobs, and consequently the shortage of skills. The change is very well shown in chart 3 on the regional labour activity rate in Poland in the Census of 1988, during the declining communist era and in Census of 2002,during the declining transition period.
Chart 3. Regional employment activity rate in Poland in Censuses 1988 and 2002
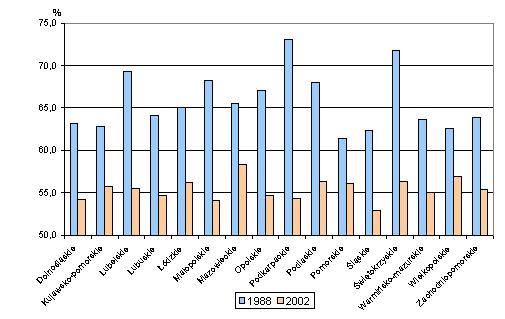
Source:
Central Statistical Office
See pdf file for full-size image
Moreover, Poland’s economic geography highlights the differential impact of the changes across the country. Poland’s regions differ considerably with regard to their economies. The variation refers mainly to their economic structures, levels of development, living standards and their labour markets. This is mainly manifested in the three sector structure of the economy (agriculture/industry and construction/services) which can be described and defined by the sectoral split of total employment and value added across regions (see table 3). The situation in Poland is unusual because of the relatively large shares of agriculture in employment but – at the same time – small shares of this sector in the value added (Kwiatkowski, Kucharski, Tokarski 2004). It is worth noting that the dynamics of changes in the employment structure are significant.
Table 3. Structure of employment (E) and value added (VA) in regions of Poland 1995-2001 (period average, in %)
|
Region (voivodship) |
Agriculture |
Industry and Construction |
Services |
|
Dolnośląskie E VA |
11.4 4.4 |
34.8 39.1 |
53.8 56.5 |
|
Kujawsko-pomorskie E VA |
21,0 6.0 |
31.0 36.8 |
48.0 57.2 |
|
Lubelskie E VA |
41.1 9.8 |
19.4 29.5 |
39.5 60.7 |
|
Lubuskie E VA |
12.4 5.3 |
34.8 31.9 |
52.8 62.8 |
|
Łódzkie E VA |
21.0 5.6 |
32.8 35.5 |
46.2 58.9 |
|
Małopolskie E VA |
27.5 4.0 |
29.8 36.5 |
42.7 59.5 |
|
Mazowieckie E VA |
21.4 4.8 |
25.0 29.6 |
53.6 65.6 |
|
Opolskie E VA |
18.2 8.0 |
37.7 39.6 |
44.1 52.4 |
|
Podkarpackie E VA |
33.2 6.0 |
28.0 38.5 |
38.8 55.5 |
|
Podlaskie E VA |
39.4 10.5 |
21.7 27.9 |
38.9 61.6 |
|
Pomorskie E VA |
11.5 3.8 |
30.5 35.4 |
57.0 60.8 |
|
Śląskie E VA |
6.7 1.8 |
46.4 45.5 |
46.9 52.7 |
|
Świętokrzyskie E VA |
34.8 8.1 |
28.1 35.0 |
37.1 56.9 |
|
Warmińsko-mazurskie E VA |
20.0 9.5 |
29.0 31.9 |
51.0 58.6 |
|
Wielkopolskie E VA |
19.3 8.5 |
34.5 37.3 |
46.2 54.2 |
|
Zachodniopomorskie E VA |
8.7 5.8 |
30.2 30.7 |
61.1 63.4 |
Source: Kwiatkowski, Kucharski, Tokarski 2004
The Swietokrzyskie, Podlaskie, Podkarpackie, and Lubelskie regions can all be regarded as typically agricultural. They are located in the Eastern part of Poland and can be characterized by a dispersed agrarian structure (small farms) with a predominance of private farms, which appeared in the previous systemic era. During the transition period these farms acted as “containers” absorbing excesses of labour, and easing social tensions in the labour market(Kwiatkowski, Kucharski, Tokarski 2004).However, at the end of the 20th century, these containers had blown up, uncovering and diffusing unadjusted labour resources.
As mentioned before, the transition period was accompanied by weakening and even collapsing branches of industry. However, the relative role of industry is still large in some regions: the Slaskie, and Dolnoslaskie regions, and also the Opolskie, Lubuskie, Wielkopolskie and the Kujawsko-Pomorskie regions. The high level of industrialization in the Slaskie region comes from mining and metal industries, which have been facing advanced restructuring during the final phase of transition.
Large shares in services, which are a testimony to the modern economic structure, can be found in the Mazowieckie Region (capital region) and throughout northern Poland (the Zachodniopomorskie, Pomorskie, and Warminsko-Mazurskie regions), where the large shares of services are mostly associated with tourism.
Regions differ also with respect to their GDP per capita. The highest and most overwhelming GDP per capita is found in the Mazowieckie region, with the capital city of Warsaw. The second highest is found in the Slaskie region, with its conurbation – the most industrialized part of Poland. The lowest GDP per capita values are found throughout the eastern part of Poland (the Lubelskie, Podkarpackie, and Podlaskie regions) but also in the Warminsko-Mazurskie, Swietokrzyskie, Opolskie, Malopolskie and Lodzkie regions. Interestingly, the sets of regions with the highest and lowest GDP per capita haven’t changed over the period of transition. In fact, gaps were seen even to deepen in this respect. In 1995 the GDP per capita in the Mazowieckie region was 64 per cent higher than the lowest regional GDP, while in 2002 the difference peaked at 98 per cent (Kwiatkowski, Kucharski, Tokarski 2004).
Regional gaps in GDP per capita are closely linked to regional variations in labour productivity (GDP per employee). The Mazowieckie and Slaskie regions seem to have the highest level of labour productivity. Also, western regions have a high level of productivity. The lowest levels of productivity are found in the eastern agricultural regions, namely the Lubuskie, Podkarpackie, and Podlaskie regions.
Regional differences between wages are considerably lower than the differences in labour productivity, but cover the same map: the Mazowieckie region claims the highest wages, followed by the Slaskie Region, with the eastern regions earning the lowest wages.
The regional map of unemployment in Poland is also interesting. The three groups of regions, which were derived from the analysis of employment structure, GDP per capita and productivity levels, are also relevant to unemployment rates. Transformation shock made regions vulnerable in different ways to its effects. The first group of regions is defined by the process of restructuring of agriculture. Among them are ‘the biggest inheritors of the centrally planned economy’: Warminsko-Mazurskie, Zachodnipomorskie, Lubuskie, Pomorskie and Kujawsko-Pomorskie regions, which all experienced spontaneous and non-covered by any governmental protective measures during the process of restructuring, which led to the emergence of high unemployment. This resulted a high drop in labour demand. The second group of regions, dominated by traditional industries (at the beginning of transition light industries, followed by heavy industries), noticed a strong drop in labour demand. The second region mainly includes the Lodzkie, Dolnoslaskie and Lubuskie regions. [1]
The smallest decrease in labour demand was noticed in three regions with modern economic structures, namely with the service industry playing a large role in the employment structure:the Mazowieckie, Małopolskie and Wielkopolskie regions. The economies of these regions managed to adapt quite flexibly to meet the requirements of a market-driven economy. The process of their adaptation was mainly enhanced by agglomeration effect: of Warsaw, Krakow, and Poznan (Kwiatkowski, Kucharski, Tokarski 2004).
The general unemployment rate in Poland mirrors the dynamics of the transformation process, which was conditioned by changes in the economic structure (e.g. sectoral restructuring). The unemployment rate rose rapidly from 1992 (12 per cent) to 1995 (16.2 per cent), and then started falling due to the stabilization of the restructuring process (10 per cent by 1998). The unemployment rate started rising again in 1999 and increased very quickly up to the end of 2005. After mid-2006 the unemployment rate started falling, reaching 14.8 per cent in the November of that year. This may have been the result of different factors that may or may not have been related to joining the EU: economic growth effect, forwarded seasonal demand (due to a mild winter) in agriculture, construction and services, and systematic outflow of labour and systematic inflow of remittances.
Chart 4. Unemployment rate in regions (voivodships) in 2005 (the end of September)
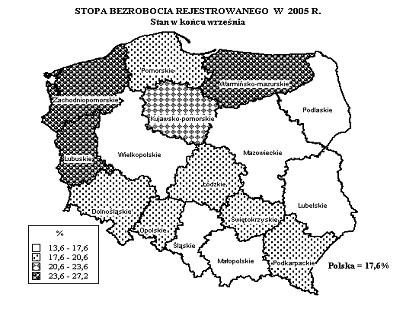
Source: Central Statistical Office
Poland also experiences the problem of hidden unemployment, which is mostly related to work in the grey economy and/or seasonal employment abroad. This is the best example of the advancing segmentation of the Polish labour market, with the primary sector having well-paid, stable jobs and the secondary sector (Piore 1979) having ‘3 D’ jobs (difficult or dull, dangerous, dirty). This structure may also intensify mismatches of supply and demand in Poland, which is responsible for skill shortages.
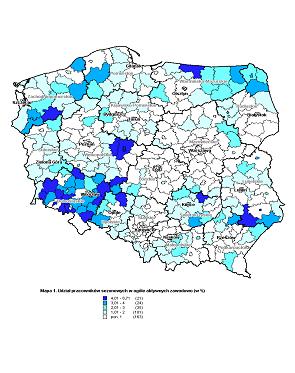
All these factors contributing to the performance of the regional labour market in Poland may suggest that Poland’s inhabitants have a strong propensity for inter-regional migration. In fact, the inter-regional mobility is very low in Poland (inter-voivodship flow rates amounted to 0.2-0.3 per cent), which may freeze regional skill shortages and create an unfulfilled demand. Inter-regional flows depend on regional variation in GDP per capita as well as on regional variations of unemployment rates. As resulted from the econometric analysis of E. Kwiatkowski, L. Kucharski, T. Tokarski (2004), the regional variation in GDP affected migration outflows more strongly than the regional variations of unemployment rates.
The map of Poland in terms of regional outflow of population mirrors regional macroeconomic changes (see chart 5).
Chart 5. Emigration from Polish regions per 1000 inhabitants in 2002 Census
Source: Central Statistical Office
Data derived by the Central Statistical Office from the Central Population Register for 2004 show that 18,877 people emigrated from Poland, while 9,495 people immigrated to Poland. However, other sources that do not draw on the registration of permanent departures from Polandand those sources of receiving countries indicate that emigration from Poland has been systematically increasing since the end of the 1990s, a trend that has accelerated since gained membership to the European Union on May 1st 2004. [2] Data compiled from the Labour Force Survey shows that in the second quarter of 2005, approximately 225,000 Poles stayed abroad for more than two months for work purposes, as compared with 193,000 in the corresponding quarter of 2004, or in comparison with 106,000 in the second quarter of 2000 (SOPEMI, Kepinska 2005). The portrait of post-accession migration from is a mixture of continuity and change. The portfolio of countries receiving migrant workers from Poland is revised somewhat, without new destinations replacing old destinations (Germany still predominates), yet with the proportional representations shifting (the United Kingdom and Ireland gaining). Change is occurring mainly through the substitution of legal migration for illegal migration, with the young and the better educated in the migration stream, and with those who migrate for the purpose of studying (SOPEMI, Kepinska 2005). Poland still experiences pendal mobility - a phenomenon of a transition period. Pendal mobility reflects the movement of a swing. As on a swing, many people were pushed from their homes in order to earn good money abroad, and then quickly pulled back to their homes in order to spend the money. This movement generated the main source of income for many households, making the majority of people involved in this movement economically inactive in Poland. This then created a new form of migration called, as based upon a survey done by the Centre for Migration Research, ‘incomplete migration’, which means temporal migration abroad without any rooting. This mostly entails working outside Poland, which is often connected to work in a secondary segment of labour market (Jazwinska, Okolski 2001). Chart 6 reflects the situation and establishes the evidence that incomplete migration engages mostly peripheral regions of Poland or those who were linked historically with neighboring countries of Poland e.g. Opolskie (Jonczy 2006).Chart 6. Rates of seasonal workers in the economically active population in Poland (%)
Source: Łukowski, Kaczmarczyk 2004
4. Education gaps
The process of transformation also affected the education system in Poland. Up until 1989, the education system in communist Poland was autonomous in practice and was very loosely attached to the labour market. The first years of transformation exhibited effects of centrally planned education. They mostly reflected a low correlation between education programs offered and the needs of the labour market regarding education levels. The occupational education is in fact a result of these changes. Lack of correspondence between occupational education and the labour market generated a high rate of unemployment of graduates of vocational schools. The system of occupational education was mainly blamed for generating this unemployment (Kwiatkowski 2000). An education perspective that is too narrow and too highly specialized makes it difficult for graduates to change occupations later on. The liquidation of occupational schools put occupational education in limbo and is still subject to inertia. No substitution measures have been implemented in order to narrow future skill gaps. A net effect is that there are nowadays very few vocational schools and their graduates are almost directly recruited by foreign companies. With extending skill shortages and limited access to state programs helping to alleviate these gaps (e.g. occupational training, courses), employers took vocational education in their hands and began to train workers on the site. This is often connected with very quick, unsystematic, ungrounded, narrow training, which may lead to exploitation. Skill shortages as revealed from data (heading 5 of the paper) reflect the existing education gaps in Poland.
The other side of the coin of
education gaps relate to the emergence of new occupations in the areas of
information, telecommunication, Internet and information technology;
biotechnology and its applications, environment protection, sea and seabed
exploitation, servicing regional integration process, modern financial
operations and e-banking, e-trade, health care, health promotion, home
assistance for elderly people, information, popular culture and entertainment
industry, and education (Borkowska, Karpinski 2001) and e-learning. Specialists
in some of these areas already exist in the Polish labour market, some need to
be educated or properly trained in order to fill the gap, and others need to be
educated or imported in order to narrow existing skill gaps and to even more
importantly fill future skill gaps.
5. Skill
shortages in Poland – what does the data[3] reveal?
Poland is now facing skill shortages and the gaps are deepening. Poland is both in shortage of engineers as well as of qualified workers: welders, ironworkers, upholsterers, bricklayers, drivers, and crane operators. Fourteen per cent of employers call for workers and in fact have problems in finding proper skills, which ultimately may limit their productivity. The problem has been increasing, also- at the beginning of 2004, 8.2 per cent of employers called for skills, while in 2005, after the enlargement of the EU in 2004, the number had increased to 14 per cent. The skill gaps are differentiated across branches and regions. For example, every fourth furniture producer in Poland cannot find employees with the proper skills, while two years ago only every tenth had problems. In the forestry industry the situation is critical. Every third employer has problems finding skilled workers, while before Poland joined the EU, it was only every fifth employer. In the construction sector, which is about to experience a boom in Poland, every fifth company cannot find workers, while before the enlargement of the EU only 3.7% of construction companies suffered from shortages. In the electronics sector, in 2005, 22.7 per cent of companies needed workers, while before May 1st 2004, only 2.2 per cent. In the automotive industry, in 2005, 20.8 per cent of companies suffered from lack of skilled workers, while before Polish accession to the EU, only 7.4 per cent experienced shortages.
6. Causes and implications of skill shortages in Poland – a synthesis and conclusion
One needs to assume that Poland is experiencing skill shortages in proportion to the phenomenal co-existence of the outflow of labour and of high unemployment. This is circumstanced by a variety of factors, which surely operate in combination. Summary Chart 6 reflects all factors derived from the above analysis. Among factors causing skill shortages one needs to position: changes in the labour structure, which is the best indication of the modernization of an economy; labour demand & supply mismatches; changes in employment activity; segmentation of the labour market; incomplete migration; periodical migration; low inter-regional mobility of labour; and education gaps.
Chart 7. Constellation of factors causing skill shortages
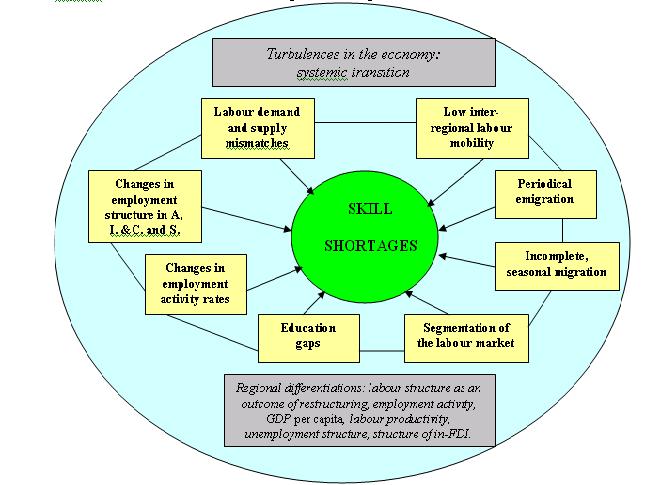
Source: own
analysis
See pdf file for full-size image
A combination of factors affecting skill shortages may lead to different implications in the labour market.
Implication 1: Extending mismatches of supply and demand across sectors, regions, and occupations may lead to disharmony and may deepen the imbalance in the labour market.
Implication 2: A high share of agriculture in a region’s employment structure and low share of services may lead to a slow adaptation to the global market, resulting in high long-term unemployment and low employment activity rate.
Implication 3: Low inter-regional mobility of labour may lead to a sustaining status quo of skill shortages and skill surpluses, which may result in a large waste of labour and extending labour pools. Ultimately this may deepen systemic transition gaps between regions.
Implication 4: Segmentation of the Polish labour market with an enlarging secondary sector may lead to an enlarging excess of labour along with increasing shortages, which unevenly may lead to an increasing demand for foreign labour.
Implication 5: Gaps between the education system and the labour demand may progressively complicate situation in the labour market, resulting in the development of new technologies, on one hand, and on the other hand, in the narrowing specialization of the economy, which hadn’t been properly managed along with changes in the education system. These gaps should create an urgent need for the recognition of occupations and specializations, as well as causing changes in the hitherto existing occupations in order to meet labour market requirements. Otherwise, skill shortages will be an indigenous defect of the transition process, which can be cured only by exogenous labour, recruited from outside the mother labour market.[4]
Implication 6: In the short-term, periodic emigration may be a solution for high unemployment (‘export of unemployment’), yet in the long-term may lead to ‘brain-draining’. Incomplete migration both in the short-term and the long-term leads to disharmony in the employment activity of indigenous labour, because people working abroad seasonally prefer to be deactivated in the local sending labour market. This means then that created, existing skills are also deactivated.
Bibliography
Abraham K., Katz L. (1986), Cyclical Unemployment: Sectoral Shift or Aggregate Disturbances, Journal of Monetary Economics, no. 94.
Brunello G. (1991), Mismatch in Japan, Mismatch and Labour Mobility, FP. Schippa (ed.), Cambridge University Press, Cambridge.
Borkowska S., Karpinski A. (2001), Emergence of new occupations and labour demand forecasting (synthesis), Government Centre for Strategic Studies, Inter-Departmental Group for Labour Demand Forecasting, Warsaw.
Davis S., Haltiwanger J., (1992), Gross Job Creation, Gross Job Destruction and Employment Reallocation, “Quarterly Journal of Economics”, no. 107.
Dorenbos R., (1999), Labour Market Adjustments in Hungary and Poland, Graduate School/ Research Institute Systems, Organization and Management.
Gawronska-Nowak B., Kaczorowski P. (2000), Regionalne niedopasowania na rynku prac, a zmiany poziomu zatrudnienia w Polsce, Ekonomista, nr 2.
Gawronska-Nowak B., Kwiatkowski E., Kubiak P. (1998), On Some Determinants of Regional Unemployment In Poland In Transition, Universita di Padova, Discussion Paper, No. 2
Jaźwińska E., Okólski M. (red.), (2001), Ludzie na huśtawce. Migracje między peryferiami Polski i Zachodu, Wydawnictwo Naukowe Scholar, Warszawa.
Jonczy R. (2006), The Role of emigration of the autochthonous population in regional development of the Opole Province, Human Capital as development factor of the region. Macro- and microeconomic approach, “Studia Regionalia” Volume 16, Polish Academy of Sciences, Committee for Spatial Economy and Regional Planning, Warszawa.
Kaczmarczyk P., Łukowski W. (ed.), (2004), Polscy pracownicy na rynku Unii Europejskiej, Wydawnictwo Naukowe Scholar.
Kaczorowski P., Tokarski T. (1997), Restrukturyzacja a odpływ z bezrobocia w Polsce (analiza oparta na rozszerzonej funkcji dostosowań), Wiadomości Statystycze, nr 11.
Kępińska E. (2005), Recent Trends in International Migration. The 2005 SOPEMI Report for Poland, Instytut Studiów Społecznych, Seria: Prace Migracyjne, Nr 60, Warszawa.
Kwiatkowski E., Kucharski L., Tokarski T. (2004), Regional economic and labour market performance and inter-regional labour market balance – the case of Poland, Journal for Labour Market Research, no. 4.
Kwiatkowski S.M. (2000), Kształcenie zawodowe i prozawodowe w reformowanym systemie edukacji a potrzeby rynku pracy i oczekiwania pracodawców, Rzadowe Centrum Studiow Strategicznych, Międzyresortowy Zespol do Prognozowania Popytu na Prace.
Lilien D.M. (1982), Sectoral Shift and Cyclical Unemployment, Journal of Political Economy, no. 90.
Loungani P., Rush M., Tave W. (1990), Stock Market Dispersion and Unemployment, Journal of Monetary Economics, no. 25.
Schioppa F.P. (ed.), (1991), Mismatch and Labour Mobility, Cambridge University Press, Cambridge.
[1] Indeed, Poland has created visa programmes for Belarusian and Ukrainian workers with this in mind. See also Bruff’s papers on Ireland in this theme.
[2] Data extracted from Central Statistics Office.
[3] One should note that today the migration outflow is much lower than in the decades of communism – mainly in the 1960s-1980s decades of the 20th century (Iglicka 2001). However, the dynamics are much bigger. Unfortunately the Polish data do not capture this outflow because they relate only to those who left Poland permanently. Labour market sources in receiving countries inform us mostly of the dynamics of emigration from Poland and not of the stock of Polish migrants. E.g. the PPS Number system in Ireland informs us of the number of Poles who appeared in Ireland (not necessarily in the labour market). When we match the PPS Number issued with employment details we can learn more about those who had commenced their employment. No Irish source gives data on the stock of migrants from Poland in Ireland, either working, non-working or unemployed. The number of PPS Numbers allocated to Polish Nationals from January 2004 to November 2006 was 183,106. Of this number, 125,720 had employment details recorded under their PPS Number. We have more information from British migration sources (Labour Force Survey (LFS), Work Registration Scheme (WRS), NINO) but still we do not have information on the stock of migrants from Poland. According to the LFS 104,000 Poles were in the UK by the end of 2005; according to WRS 197 000, according to NINO 171 000.
[4] The fall in demand in heavy industries was fairly mild and dispersed over time. Soft not shock measures were implemented during the process of restructuring the heavy industries. This was achieved thanks to the strong pressures of trade unions who managed to win special treatment from the state.